This exercise was revised by Sarah Taylor in 2020. If you know who created the original activity, please let us know! A pdf version of this activity is available here.
Some Connecticut plants are found less frequently now than they once were.
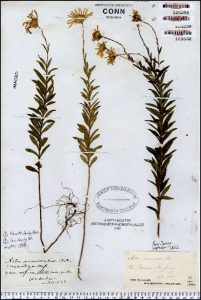
Below is a list of such species. You can document the declines by going to the website of the University of Connecticut’s George Safford Torrey Herbarium and conducting a search for these species. Do not limit the search to Connecticut but obtain all specimens in the database.
After conducting the search, record the date on which each specimen was collected.
Then add up the number of specimens that were collected each decade since the first collection and plot the data.
| Years | Number of Records |
| 1890-1900 | |
| 1901-1910 | |
| 1911-1920 | |
| 1921-1930 | |
| 1931-1940 | |
| 1941-1950 | |
| 1951-1960 | |
| 1961-1970 | |
| 1971-1980 | |
| 1981-1990 | |
| 1991-2000 | |
| 2001-2010 | |
| 2011-2020 |
You will not be able to generate a map for these species because the herbarium suppresses the precise location information. The herbarium does this because many of these species are on the state’s endangered species list, and it is important to discourage unscrupulous collectors, who might otherwise want to collect these rare plants. Some of the world’s most beautiful plants are threatened with extinction because collectors harvested so many of the plants growing wild to sell them to gardeners.
After plotting the data, get information on the species from the Plants database (or other web sites; the Plants database also will tell you the common name of your plant). Look especially for information that might help explain why the species is less widespread than it once was.
QUESTIONS TO ANSWER AFTER REVIEWING THE DATA:
1.Is this a species that has, in fact, declined over time?
2. Is this a species that apparently always has been rare in Connecticut?
3. If this species has declined in frequency over time, give three reasons that might account for the decline.
4. What else might account for changes in the number of specimens that have been collected? In other words, can you think of situations in which a species might not actually decline in frequency but in which there would be fewer specimens collected, giving the appearance of a decline?
5. Are there species here that don’t appear to be rare at all and possibly should be considered for removal from the state’s endangered species list?
Species list
| Abies balsamea Alopecurus aequalis Anemone canadensis Arethusa bulbosa Aristida longespica Aristida purpurascens Asplenium montanum Aster nemoralis Aster radula Aster spectabilis Betula pumila Botrychium simplex Cirsium horridulum Corydalis flavula Cryptogramma stelleri |
Cypripedium acaule Cypripedium arietinum Cypripedium parviflorum Cypripedium reginae Deschampsia caespitosa Dicentra canadensis Diospyros virginiana Diplazium pycnocarpon Dryopteris campyloptera Dryopteris goldiana Equisetum palustre Equisetum scirpoides Eupatorium album Hudsonia ericoides Hudsonia tomentosa |
Isotria medeoloides Krigia biflora Ledum groenlandicum Lipariss liliifolia Liquidambar styraciflua Lycopodium selago Lygodium palmatum Malaxis monophyllos Malaxis unifolia Megalodonta beckii Morus rubra Oxalis violacea Pinus resinosa Platanthera blephariglottis Platanthera ciliaris |
Platanthera dilatata Platanthera flava Platanthera hookeri Platanthera orbiculata Polymnia canadensis Potentilla arguta Sagittaria subulata Scutellaria integrifolia Thuja occidentalis Vitis novae-angliae |