Biologists use online databases of plant specimen data to explore many phenomena. We hope these examples will give teachers and students ideas about the kinds of research and educational exercises they might do with our Virtual Herbarium or with other online databases.
These are all “real” examples in the sense that they all were the products of research on plants of the Northeast United States, they all involved the use of herbarium specimens, and the information used in the graphs is available through our online database. All of these graphs were published or used in formal presentations to groups concerned about managing invasive plants, so, although they may seem simple in some ways, each made a contribution to our understanding of where these plants occur, how that is changing over time or why the plants occur where they do.
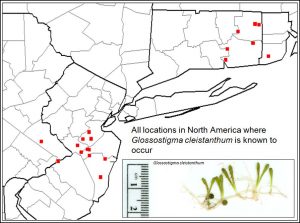 This first example is from a paper about an aquatic plant called mud-mat or Glossostigma cleistanthum. This plant is a native of Australia and New Zealand and started showing up in the Northeast only in the 1990s. We don’t know how aggressive it is, but it is spreading quickly, and we fear it may become aggressive. The plant occurs now as far south as Maryland, but when this paper appeared it was known only from Connecticut, Rhode Island, New Jersey and Pennsylvania. The paper pointed out that Glossostigma prefers certain lakes with sandy bottoms and clear, slightly acidic water. Long Island has many lakes like that. We suspect that migratory waterfowl, which often eat aquatic plants, are moving the seeds around, and many ducks pass over and stop in Long Island ponds during migration. This makes Long Island ponds likely habitat for Glossostigma, although it has not yet been found there. Because of the likelihood that this new, potentially invasive plant may occur in the area, The Nature Conservancy began summertime surveys looking for Glossostigma on Long Island. To create your own map of Glossostigma populations, go to the Virtual Herbarium, click on “Herbarium Database” and conduct a search for “Glossostigma cleistanthum .” When you get the results, click on “Map these results” at the top.
 The database also allows researchers to study increases or declines in the frequency of plants. One way to do this is to obtain information on the number of populations of a species that exist each year. Map the Glossostigma data as before. On the right, click on “Options.” Then click on “Download records.” You then can sort the specimen records by year and make a simple plot in any spreadsheet software (Excel, Google Sheets, etc.) showing how many populations exist, adding each year’s new populations to the number that existed previously. A graph like this can be modified, adding more species, to see which species are spreading most rapidly. Information like this can be useful for conservation officials. They often have to decide how best to use their resources when there’s not enough to do everything that needs to be done. We have many invasive aquatic plants in the Northeast, and there is never enough money to control them. A plot like the one at left suggests that, although Glossostigma is increasing, a different invasive aquatic plant, Najas minor, is spreading even more quickly.
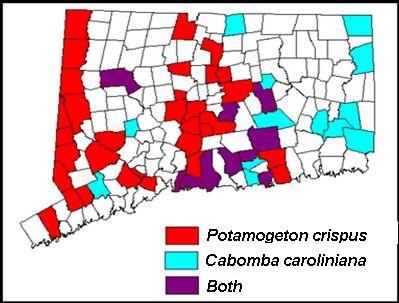
In this case, we have used the online database to obtain information on all the Connecticut towns in which two different invasive aquatic plants occur. We then used a blank map of the towns in Connecticut to plot where the two species occur (town names are on this map). Instead of providing information about how the species are increasing (or declining) over time, this map shows that the species occur in different parts of the state. Curly leaf pondweed (Potamogeton crispus) occurs primarily in the western part of the state, whereas fanwort (Cabomba caroliniana) occurs almost entirely in eastern Connecticut. The reasons for this have to do with the ecological affinities of the plants: they like somewhat different environmental conditions. Pondweed is usually found in the more alkaline, hardwater lakes we find in the western part of the state and along the coastal plain. Fanwort, on the other hand, prefers the slightly more acidic water found in the lakes of eastern Connecticut. We often find differences like this among plants. Some species are generalists and can be found pretty much anywhere, but many other species establish, grow and reproduce only where the conditions are just right. Ecologists think of them as specialists on those conditions. In this case, we have mapped variation in occurrence of two species over space, but we can use similar maps to investigate how species vary over time, sometimes using county maps instead of town maps.
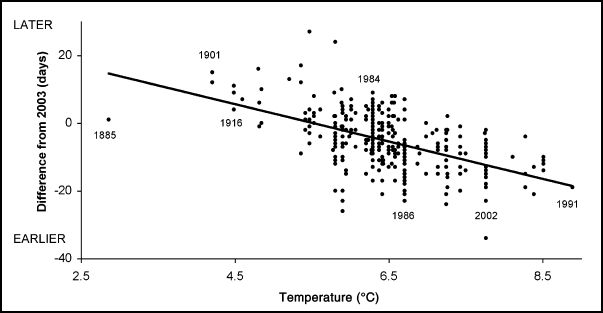 This graphic uses a somewhat more sophisticated analysis to show how the flowering time of plants has changed in the past 100 years as the climate has become warmer. This analysis by Richard Primack and his coworkers was done entirely with herbarium records at the Arnold Arboretum in Boston. The research shows that plants are flowering 6 to 10 days earlier now than they did 100 years ago and that this is related to the warmer conditions that prevail now. This classroom activity gives students hands-on experience doing this kind of research. Other work by these biologists shows that many of the species that are not adapting to the changing weather conditions now are declining in abundance. Changes in flowering time are of great importance to many animals as well, because they rely on the plants to provide food. Insects that emerge in the spring need leaves or sap to feed on. Many of the migratory birds that return to the Northeast each spring time their arrival to coincide with the emergence of those insects. If the insects appear earlier but the birds don’t, the birds may not find the food they need for their young. Changes like this are thought to be behind the declines of some bird species.
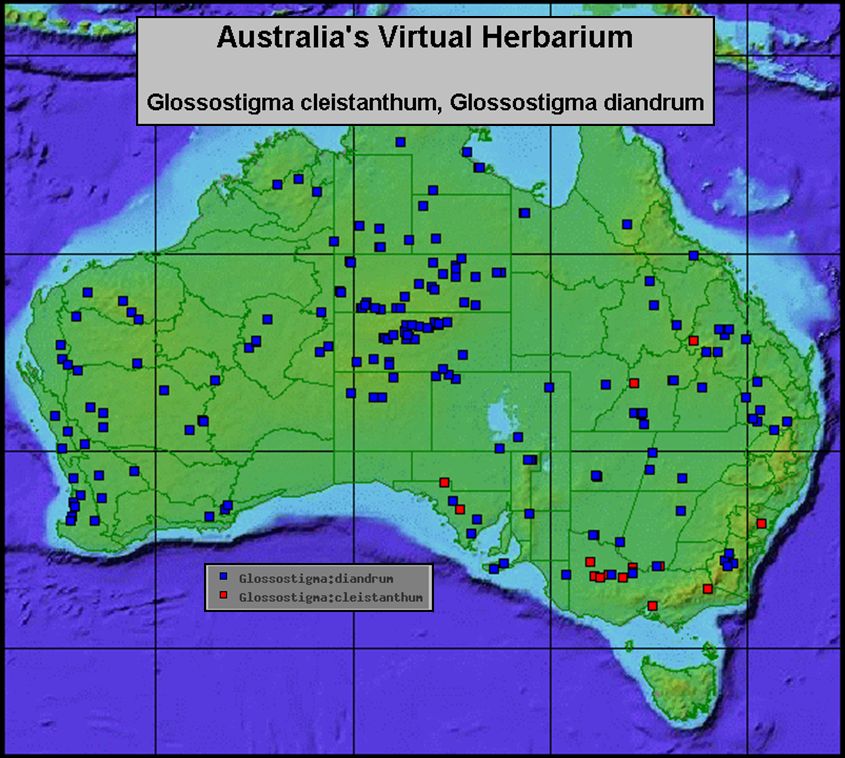 Mapping specimen records available from online databases also can reveal anomalies in the distribution of species. There can be several causes of these. If a species has a population that is far distant from all other populations of a species, it might mean that the species once had a much larger range and now is contracting for some reason. This map was produced with data from the Virtual Herbarium of Australia and it shows populations of two species of Glossostigma in their native range. One of the plants (the one in blue) has a more northern distribution, occurring in the warmer parts of Australia, whereas the other (the one in red) is limited largely to the more temperate areas along the southern coast. These species are very hard to tell apart, and we suspect that the two most northern red populations have been misidentified; those probably are the blue plant. It is unlikely, though not impossible, that the red plant occurs that far north; it is probably too warm there for that species. Incidentally, it is the plant with the more temperate distribution (the red plant), Glossostigma cleistanthum, that is spreading now through the northeast United States.
Herbarium specimens have many other uses. They are used in education to help students learn the traits that distinguish one family from another. Specimens are used by biologists trying to identify a plant they have collected. Specimens also can be used for molecular analyses that reveal how species are related to each other. All of these kinds of research require that biologists inspect the actual specimens, and they cannot be done with an online database. Many kinds of research, though, can be done remotely just as easily as they can be in the herbarium. All of these analyses rely on the increasing number of databases that are making herbarium specimen records available over the internet. We encourage students, teachers and biologists to come up with new ways in which the online data can be used. And let us know what you discover! You can contact us by emailing our Collections Manager, Sarah Taylor